terroir that travels

The maps premiered at an exhibition in Lautrec, France, and were part of a larger storytelling experience, including stereoscopic viewers and interactive displays. For me, this project was an opportunity to expand how we use cartography in the context of climate and culture—not as fixed records, but as living tools for imagining transition.

These maps were the basis for both research and storytelling. They were used in the final installation to visualize the future “routes” of iconic regional products—such as the potential northward migration of French garlic due to rising temperatures. My work helped ensure that the complex data remained accessible to a broad audience, from local growers to policymakers.

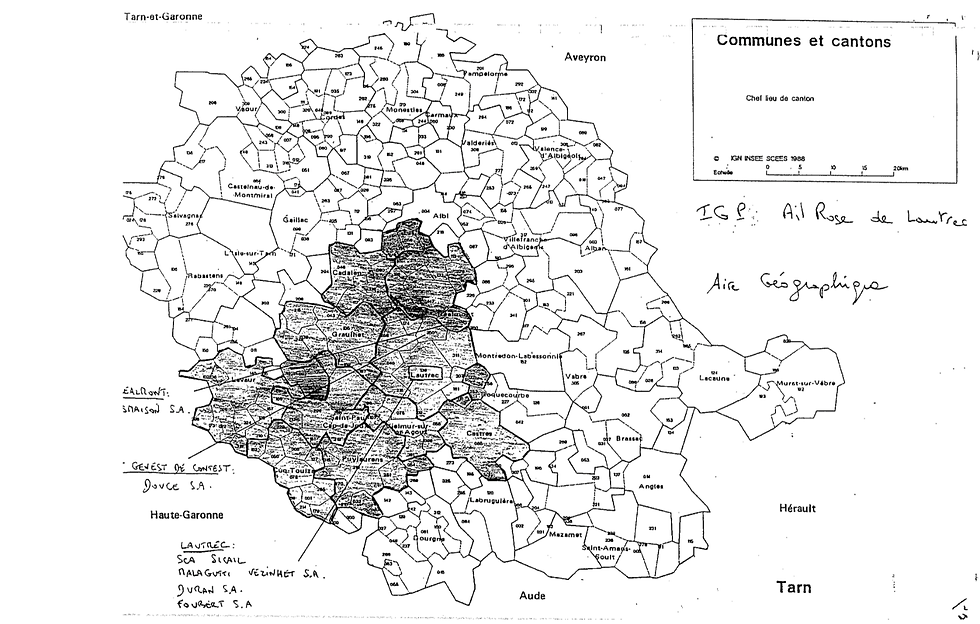
We began by building the database of all PDO/PGI agricultural products across the EU, working from the official EU register. Lately overlaid this data with future climate scenarios to identify areas where these products might thrive under new environmental conditions. Together with Eugene Kalinouski, we developed two map types: a static 2024 baseline and a dynamic migration map showing predicted shifts by 2080.
Year
2024
TERROIR THAT TRAVELS MAPPING
With The Center for Genomic Gastronomy, Eugene Kalinouski
The project uses maps and stories to ask how agricultural products and taste of place will migrate due to climate change. Where we are interested in demonstrating some of the taste-of-place (terroir) that will have to migrate (travel) due to climate-changed agricultural landscapes.
TTT endeavors AI-driven research on consequences of climate change for PDO areas in EU27 member states. During the research we used the data from the European register with the names of agricultural products registered and protected across the EU, later overlaying them with the climate change data.
technical facts
-
Project idea and coordination: The Centre for Genomic Gastronomy
-
Research & presentation: Camille Pelissou
-
Map-making: Nataly Khadziakova Studio, Eugene Kalinouski
-
Support & hosts: European Cultural Foundation’s Culture of Solidarity Fund – Just Transition; Waag Space Lab; Ars Electronica 2023; Space4Good mentorship
